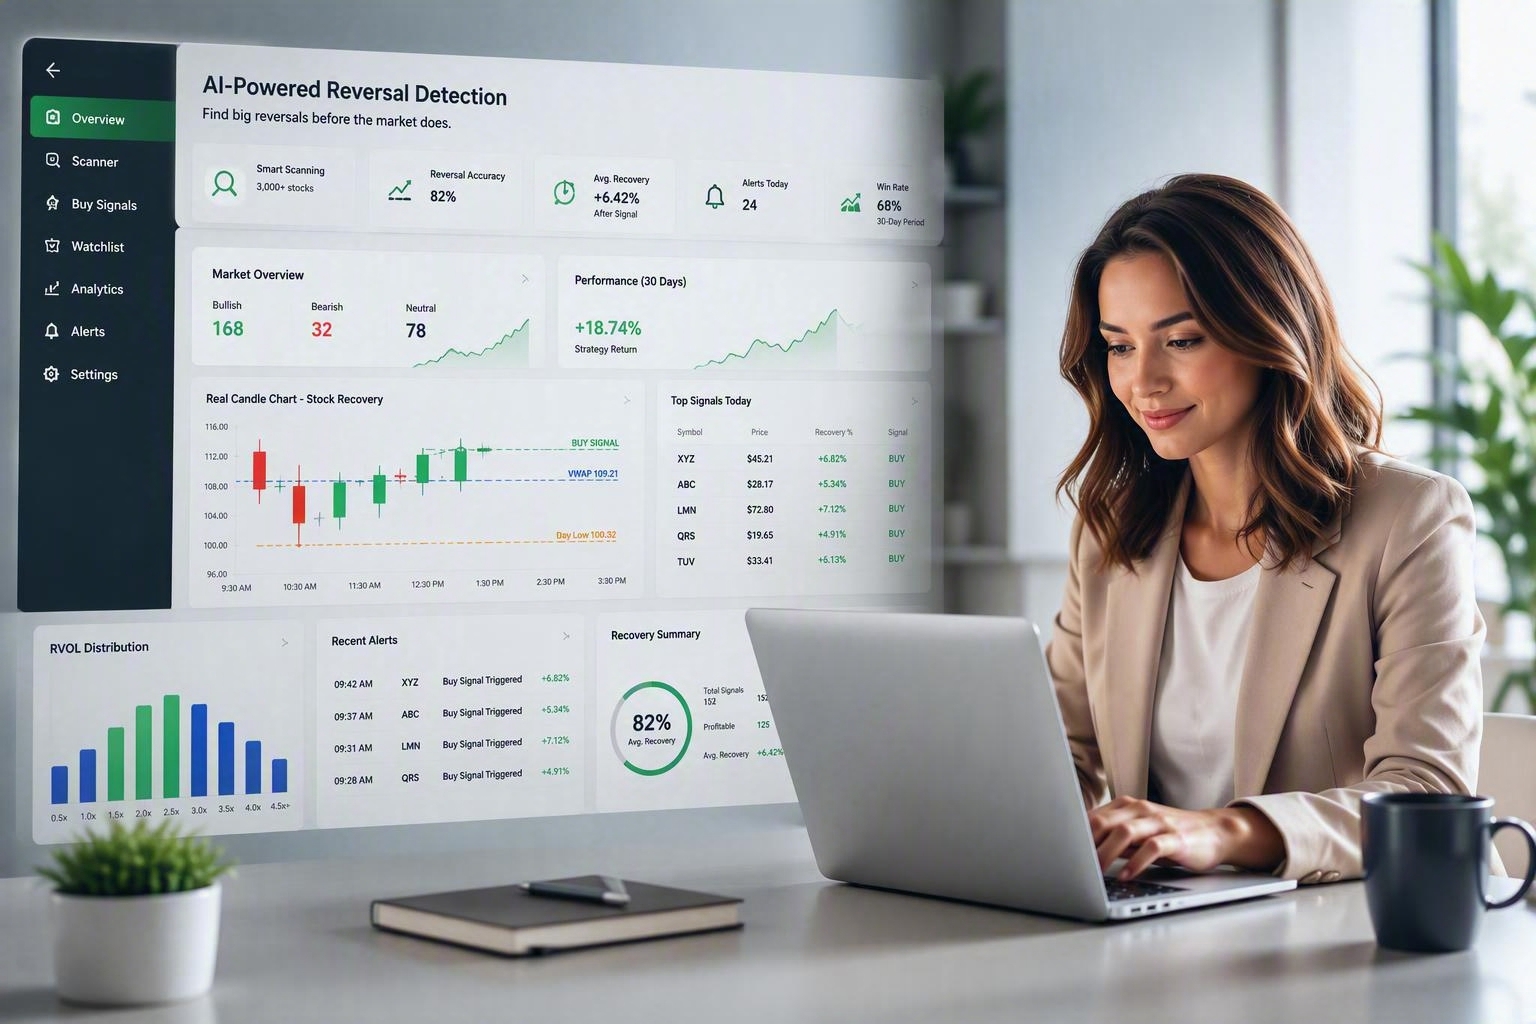
Real stocks, live data, updated throughout the trading day - click any row for the full reversal chart
| Symbol | Entry Date | Price | Change % | Volume | Recovery % | Status |
|---|---|---|---|---|---|---|
| Loading live watchlist... | ||||||
No account needed to view our top picks - this is the same live data the trading dashboard uses. Visit every day to find the latest ones.
Intelligent 2-stage pipeline scans 2000+ stocks in seconds, identifying the biggest daily losers automatically.
Advanced indicators track market momentum and reversal strength with real-time calculations.
7-condition comprehensive buy criteria, individually calibrated per stock rather than one fixed bar for every ticker.
Track intraday reversal progress from market lows with accurate recovery percentage calculations.
Full control over trading parameters, plus an automated historical backtest that periodically re-tunes every stock's buy thresholds from real price data instead of a fixed guess.
Live watchlist with detailed stock analytics, charts, and detailed buy readiness information.
| RSI Range | Interpretation | Count |
|---|---|---|
| 0-30 | 🔴 Oversold | 5 stocks |
| 30-50 | 🟡 Recovering | 12 stocks |
| 50-70 | 🟢 Neutral | 18 stocks |
| 70-100 | 🔵 Overbought | 8 stocks |
| Component | Weight | Avg Score |
|---|---|---|
| Price Recovery | 25% | 18.5 |
| Volume Strength | 20% | 14.2 |
| VWAP Breakout | 15% | 9.8 |
| RSI Recovery | 20% | 12.3 |
| Trend Samples | 20% | 15.6 |
Find biggest daily losers across 2000+ stocks using intelligent 2-stage filtering
Monitor intraday recovery patterns with real-time price and volume updates
Calculate 5 technical indicators (RSI, VWAP, MACD, EMA, Recovery %)
Compute weighted reversal score from 5 components for strength assessment
Buy when all 8 conditions met with automatic position sizing and alerts
Scan 2000+ stocks in seconds. Alerts within milliseconds of signal confirmation.
8 buy conditions - most with their own per-stock calibrated threshold - reduce false signals from noisy one-size-fits-all rules.
Buy thresholds aren't hand-picked - a historical backtest simulates each stock's own past price action against the real stop-loss and trailing-stop rules to find what actually would have worked.
30+ settings to tune thresholds and weights to your trading style, down to per-stock overrides and global on/off switches for individual buy conditions.
Live charts, indicators, and buy readiness status at a glance.
Automated hourly monitoring during market hours. Never miss a signal.
Start with a free trial and access all features. No credit card required.